Installing
PCL Analysis (Menu interface)
UNIX
1) Make sure Perl is installed in /usr/bin/perl
a. If it isn’t, go to http://www.perl.com/ to find out how to install Perl
2) Download and unpack the UNIX distribution
3) Go to the directory containing PCL_Analysis and type:
chmod u+x
PCL_Analysis.pl
4) Run the program by typing:
PCL_Analysis.pl
5) If you want to use cluster, knnimpute, classminer or svd go to the Stanford Microarray Database software page at http://genome-www5.stanford.edu/MicroArray/SMD/restech.html and download the appropriate programs. You will need to place the executables in your working directory and make sure they have the following names for them to work properly.
CLUSTER: cluster
KNNIMPUTE: knnimpute
SVD (Contact Gavin Sherlock): svd.out
CLASSMINER (Contact Olga Troyanskaya): classminer
WINDOWS
1) Install ActiveState Perl
a. Go to http://www.activestate.com/Products/ActivePerl/
b. Click “Download”, then “Next”, then “MSI” (next to Windows)
c. When prompted, choose “Open” and follow the installation instructions
2) Download and unpack PCL_Analysis (Windows distribution)
3) To install clustering software:
a. Install the software from:
http://genome-www5.stanford.edu/MicroArray/SMD/restech.html,
b. Put the cluster program in the same directory as PCL_Analysis and rename it to “cluster.exe” if necessary
4) cluster.exe, PCL_Analysis.pl and PCL_Analysis.pm must all be in the same directory
5) To run the software, double click on PCL_Analysis.pl
(if this doesn’t work, make sure that Perl is associated with the .pl file extension).
MACINTOSH (OS X)
1) Follow the UNIX installation instructions
Author contact info:
John Isaac Murray
To inquire about KNNimpute or Classminer
Olga Troyanskaya:
To inquire about XCluster or svd.out
Gavin Sherlock
Using
PCL Analysis (Menu interface)
The menu interface is the simplest method for using PCL Analysis. Run the program “PCL_Analysis.pl” from the UNIX or Mac OSX command line or double click on “PCL_Analysis.pl” in Windows. The following menu screen will appear:
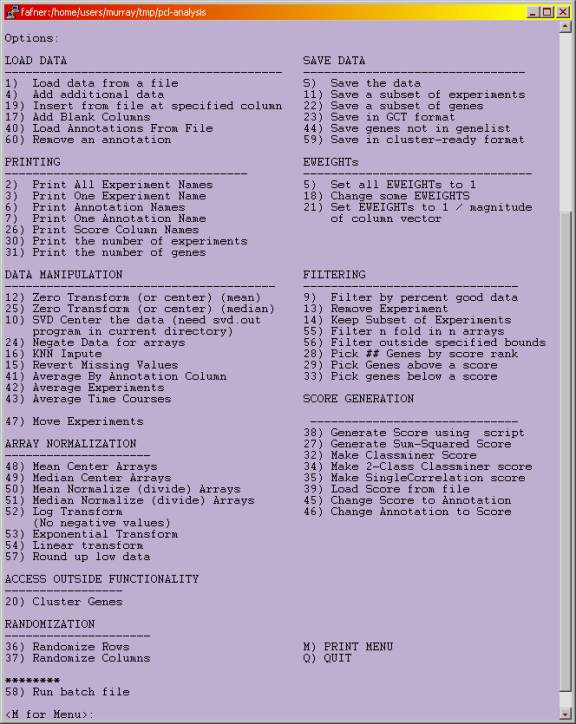
Each “command” is accessed by typing its number, followed by the enter key. In most cases, the commands are self-explanatory (for example “Load data from a file”). Unless otherwise specified, files must be in “PCL” format:
http://genetics.stanford.edu/~sherlock/cluster.html#formats
Descriptions
of individual menu options
Options for adding data or annotations
|
1 |
Load Data From File |
Prompts the user for a
filename. The file must be in
extended PCL format (see Table 1). The data is loaded into memory and then can be manipulated using
the various other functions. The
first column should contain a unique identifier that specifies the identity of
the data (e.g. gene) on each row. |
|
4 |
Add Additional Data |
Used when a dataset is already
in memory, and the user wants to add additional experiments from another file
to the current dataset – the file must be in extended PCL format and will be
added after the last column of the current data. The first column unique identifiers should be the same as for
the data already in memory. |
|
Insert From File at
Specified Column |
This is like “Add Additional
Data” (4), but the user can specify an arbitrary column number after which to
insert the data, or insert the data at the beginning of the dataset (by
specifying column ‘-1’). |
|
|
17 |
Add Blank Columns |
Allows the user to add blank
columns (data columns containing no data values) after the specified columns,
which is useful during visualization for making the boundaries of related
experiment sets apparent. |
|
40 |
Load Annotation
from File |
Allows the user to add
additional annotations for each gene (from a file). The first column of the file should contain the same
identifiers as the data already in memory.
These new annotations do not have to be unique (for example they could
contain Gene Ontology category names). |
|
60 |
Remove Annotation
Column |
Allows the user to remove an
annotation column that is no longer needed |
|
47 |
Move Experiments |
Allows the user to move a set
of data columns to a different position in the dataset |
Options for printing information about the current dataset
|
2 |
Print All
Experiment Names |
Prints the names of each
experiment, and their column numbers, one per line. This is useful in determining the column number corresponding
to a specific experiment |
|
3 |
Print One
Experiment Name |
|
|
Print Annotation
Names |
Prints the names of each
annotation column, and their column numbers |
|
|
7 |
Print One
Annotation Name |
|
|
26 |
Print Score Column
Names |
Prints the names of each score
column, and their column numbers |
|
30 |
Print Number of
Experiments |
Prints the total number of
experiments in the dataset |
|
31 |
Print Number of
Genes |
Prints the total number of
rows (usually genes) in the dataset (useful after filtering) |
Options for changing array cluster weighting information
|
5 |
Set all EWEIGHTs to
1 |
self explanatory (see Table 1
for definition of EWEIGHT) |
|
18 |
Change some
EWEIGHTs |
Allows the user to set the
EWEIGHTs for a specified set of data columns to a user-specified number |
|
Set EWEIGHTs to 1 /
magnitude of column vector |
Automatically normalizes the
EWEIGHT values to 1 / the square root of the sum-squared expression values
for each data column. This has the
effect of equalizing the impact of each data column on clustering (normally
data columns with large expression values have the greatest impact in
clustering) |
Options for transforming the data
|
12 |
Zero Transform (or
center) (mean) |
The “zero transform” functions
allow the user to (for each gene) subtract the average expression from one
set of experiments from the expression in each of another set of
experiments. For example, subtracting
the average of the zero-time point experiments from all experiments in a time
course (“zero transforming”) or subtracting the average of a set of related
experiments from each of those experiments (“centering”). This option subtracts the mean. |
|
25 |
Zero Transform (or
center) (median) |
Like Zero Transform (mean)
except it subtracts the median expression from a set of experiments from
another set of experiments |
|
SVD Center the data |
Requires that the program svd.out
is in the current directory. It uses
the functionality of this program to subtract the most prominent eigengene
(derived from a single value decomposition of the data) from the data matrix
(which is usually similar to mean centering). See (Alter et al., 2000)
for more information on SVD. This
requires a full data matrix |
|
|
Negate Data for
arrays |
Flips the sign of each
specified data column (useful for fluor-reversed data) |
|
|
KNN Impute data |
Requires that the program knnimpute
be in the current directory. It uses knnimpute
(Troyanskaya et al., 2001)
to estimate values for any missing datapoints in the dataset (it is
recommended that these values be reverted – see next entry – when they are no
longer needed and that they not be used to draw direct inferences) |
|
|
Revert Missing
Values |
Looks in a user specified PCL
file (which should have the same genes and experiments as the file currently
in memory) and for each blank datapoint in the file, it makes the equivalent
point in memory blank |
|
|
Average by
annotation column |
Creates a new dataset
containing one row for each unique annotation in the user-specified
annotation column; the data in each row of the new dataset is the average
(mean) of all rows in the original dataset with that annotation |
Options for normalizing the experiments
|
48 |
Mean Center Arrays |
Subtracts the mean expression
for all genes in an array from each data point in that array (normalizing in
log space) |
|
49 |
Median Center
Arrays |
Subtracts the median
expression for all genes in an array from each data point in that array
(normalizing in log space) |
|
Mean Normalize
(divide) Arrays |
Divides each expression value
by the mean for that array (normalizing in ratio or linear space) |
|
|
Median Normalize
(divide) Arrays |
Divides each expression value
by the median for that array (normalizing in ratio or linear space) |
|
|
Log Transform |
Log transform each data value
(linear spaceàlog
space) |
|
|
Exponential Transform |
Exponentially transform each
data value (log spaceàlinear space) |
|
|
Linear Transform |
Multiply each data value by a
constant |
|
|
Round up low data |
Makes all data values below a
specified constant equal to that constant.
Useful for negative data in linear or ratio space which cannot be
log-transformed otherwise |
|
|
Average Experiments |
Creates a new data column
containing the average data from the specified experiments. |
|
|
Average Time
Courses |
The user specifies two sets of
data columns (which are directly comparable, e.g. replicates), and the
program creates an equal number of new data columns containing the average
from each pair of samples from the two input sets |
Options for generating and computing on gene scores
|
38 |
Generate Score
using script |
|
|
27 |
Generate
sum-squared score |
Makes a new score column
containing the sum of the squares of the expression values in a specified set
of columns for each gene |
|
Make classminer
score |
Requires that the program classminer
(Troyanskaya et al., 2002)
is in the current directory.
Calculates the significance of any differences in the expression in
one set of experiments versus the other experiments, using a rank-sum test,
and puts the p-values in a new score column |
|
|
Make 2-class classminer
score |
Same as classminer
score, but looks at the difference between one arbitrary set of experiments
and a second arbitrary set of data (rather than all the remaining
experiments) |
|
|
Make
SingleCorrelation score |
Requires that the program
singlecorrelation be in the current directory. The user specifies the name of a small PCL file, and for each
data row in the new file, the program creates a new score column in the file
in memory containing the Pearson correlation between that row and each gene
in the dataset. |
|
|
Load Score from
file |
User specifies a file with the
same unique first column as the current data and program creates a new score
column and fills it with a specified column of the file. |
|
|
Change score to
annotation |
Turns a score column into an
annotation column |
|
|
Change annotation
to score |
Turns an annotation column
into a score column. The default when
loading an extended PCL file is for all the columns before the GWEIGHT column
to be annotation columns, so this is needed to allow the user to load a file
with scores |
Options for filtering the data
|
9 |
Filter by percent
good data |
Removes all genes that do not
have at least a specified percent of their datapoints present |
|
13 |
Remove Experiments |
Removes the specified data
columns |
|
Keep subset of
experiments |
Keeps only the specified data
columns |
|
|
Filter n fold in m
arrays |
Removes all genes that do not
have at least m experiments with an absolute value expression greater than
specified (n) |
|
|
Filter outside
specified bounds |
Removes all genes within or
outside of two arbitrary boundary values (for example keep genes with
expression greater than 500 or less than 20) |
|
|
Pick ## of genes by
score rank |
Picks the top ## genes based
on the highest values in the specified score column |
|
|
Pick genes above a
score |
Removes all genes that do not
have a score greater than the specified value in a specified score column |
|
|
Pick genes below a
score |
Removes all genes that do not
have a score less than the specified value in a specified score column |
|
S or s |
Save the data |
Saves all of the data from
memory to an extended .PCL formatted file (see Table 1) with a user-specified
filename. The column order is
Annotations, then Scores, then GWEIGHT, then Data. All annotations, scores, data are saved. |
|
59 |
Save in
cluster-ready format |
Saves the data from memory in
“strict .PCL” format (see Table 1), suitable for input into Gavin Sherlock’s
XCluster software (Sherlock,
1999) |
|
Save a subset of
experiments |
Saves data from a
user-specified subset of the experiments to an extended .PCL file |
|
|
22 |
Save a subset of
genes |
Saves data for only the genes
in a specified genelist file (containing one gene identifier per line) to an
extended pcl file |
|
44 |
Save genes not in
genelist |
Saves data for genes that are
NOT in a specified genelist file to an extended pcl file |
|
23 |
Save in GCT format |
Saves all the data in .GCT
format (see Table 2) |
|
20 |
Cluster genes |
Requires that the progam
cluster be in the current directory.
Makes a hierarchical cluster (.cdt, .gtr files) from the data in the
specified set of columns. (see http://rana.lbl.gov/EisenSoftware.htm
for information in cluster and treeview) |
|
36 |
Randomize Rows |
Randomizes the order of the
data values in each row |
|
Randomize Columns |
Randomizes the order of the
data values in each column |
|
|
Run batch file |
Runs a batch file, which
contains a sequence of commands, as they would be entered manually into the
program, one per line. |
|
|
Print Menu |
|
|
|
Quit |
|
Using
PCL Analysis (Descriptions of functions)
Individual functions and syntaxes will be described here eventually.